In Part 2
We will see how the analyst or software determines if the vibration levels and patterns are normal, or if problems exist in the machine.
There are many guides analysts have used to determine the severity of the machine’s vibration, such as:
- Overall Vibration Level Charts
- ISO values
- Trends of overall vibration levels
- Recognition of fault patterns in machine components.
Overall Vibration Level Charts
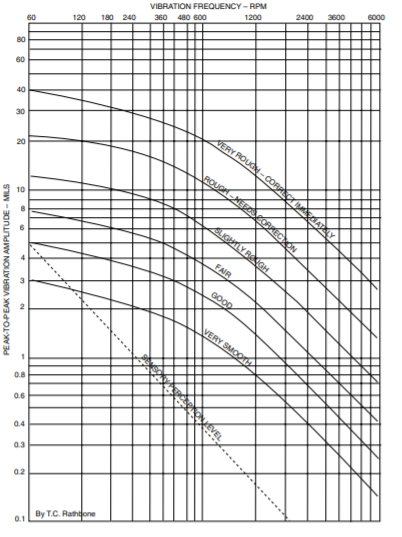
The earliest chart used in determining vibration problems was developed in the 1930’s by an engineer named T.C. Rathbone. This chart plotted the overall vibration level amount (amplitude) versus the frequency (speed) of the machine.
Ironically, Rathbone came up with this chart many years before measuring vibration became common in industry.
Even though it is almost a century old, it is still used in many industries.
Additionally, there are many other charts and tables, published by machinery manufacturers, vibration analysts, and engineers. Most of them are similar.

ISO Values
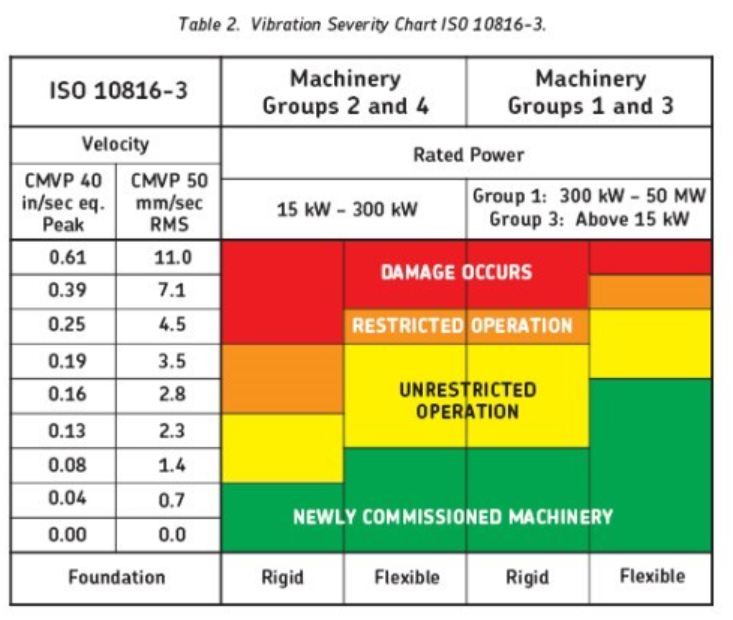
ISO 10816-3 is a modern updated chart to determine the health of a machine. It bases levels of overall vibration amplitude (in velocity) to determine the operating condition of the machine.
It also separates these alarm levels further by differentiating machines by horsepower, and by whether the machine is sitting on a solid base, or is supported by vibration isolators, such as springs or neoprene pads.
ISO 10816-3 further separates values into four categories:
- Newly Commissioned Machinery (Green)
- Unrestricted Operation (Yellow)
- Restricted Operation (Orange)
- Damage Occurs (Red)

Trends of Overall Vibration Levels
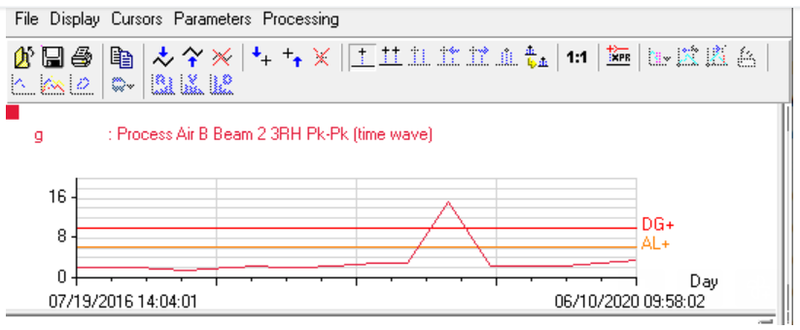
Vibration levels are often trended over time. An increase in overall vibration often is an indication of a worsening condition in the machine. Alarm levels can be set using the ISO 10816-3 specification, statistical modelling, or manually by the analyst themselves. Alarm levels can be set to only give the analyst or software an alarm when an overall vibration level exceeds a specified setting.

Allowing overall alarm values to “filter out” machines that are operating normally gives the analyst more time to devote to machines that are actually in an alarm condition.
Recognition of Fault Patterns in Machine Components
A good vibration analyst is always looking for patterns in the time waveform or spectral data. Discrete vibration frequencies, such as bearing and gear fault frequencies, blade or vane pass frequencies, electrically induced vibration frequencies, etc., can often be signs of electrical, bearing, or gear failure modes, rubs, buildup, and more.
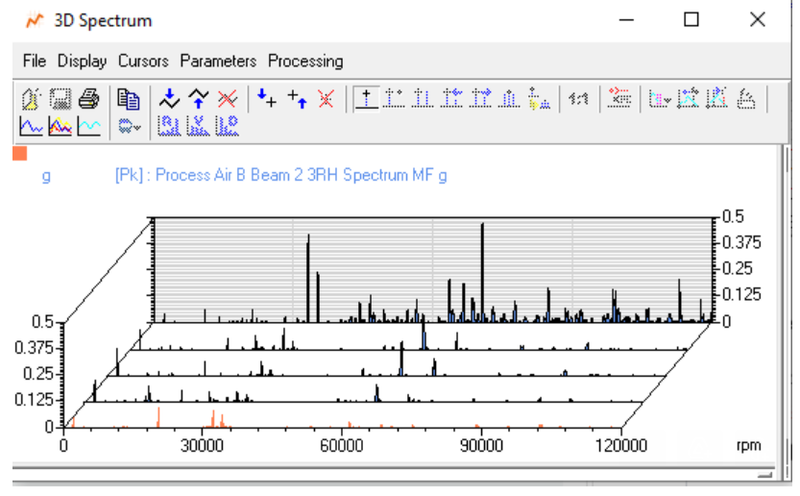
Manual diagnosis requires the analyst to constantly be looking for unusual patterns, or increases of vibration amplitudes, such as this waterfall display (right). Automated diagnostics will also catch this problem, due to the increasing amount of vibration energy in the vibration signal.

A waterfall spectrum overlays measurements taken at different times, such as monthly routine measurements. Noting an increase in vibration amplitudes, or propagation (spreading out) of the signal is a good indicator of impending failure of the machine component(s).
All of this information about the machine can be extrapolated by the various measurement methods, giving the analyst a good idea if the machine is:
- Operating normally
- Has a mechanical or electrical problem developing
- The severity of the problem
- If changing conditions in the machine process increases the likelihood of damage.
Vibration analysis of machinery is simply a measurement, like length, temperature, or speed. It is up to the analyst, and maintenance and engineering, to determine the next steps.


