Adding Process Points to a Data Collection Route

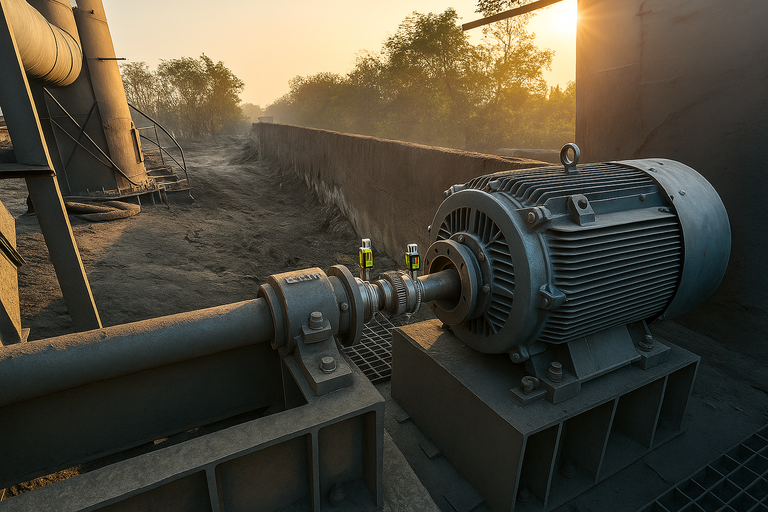
Sometimes other data can influence analysis when running your regular routes. This data can range from discharge pressure on pump to slide valve position on a chiller or maybe just bearing temperature just to name a few. With the Falcon and Nest this type of data can be collected and even trended in the Nest.

Adding these points is very simple and can be done when building a new machine or added later. To add a point to a machine you’ll need to access the Nest and the Set up Machine module.

Once in the setup machine module you can select the machine you want to edit or build a new machine as normal. Once the new machine is set up or after opening an existing machines you’ll need to access the Measurements tab.

Under this tab you will see a header titled Process data.

By clicking on Process Group you’ll be given options as the image below shows.

For the scope of this discussion we will focus on the “Add Scalar Group DC” selection. Select this and a point will be added for you. Once added you can configure it by selecting the added point and clicking “Add Treatment” above it.

Again, for this discussion we will focus on a single selection and choice “Other”. This option will allow us to dictate what we input and its related unit of measure.

We can change the name of the data point to fit our needs as in this case discharge pressure. We will then define our input type again and in this case it’s Keyboard Input.We can then change the input type to the unit of measure we want to reference for our measurement. Further refinement of the point can include alarms level and relative alarms based on percent of change.

Once any points you’ve added have been set up you can click save on the far right of the screen and load the route to the data collector.

In the Falcon data collector these points will show up on a machine but be placed prior to regular vibration data collection points. Simply select acquisition on the Falcon and the values can be entered. Temperature is the required value in the example image below.

After the data has been loaded back into the nest the data points will become a trendable point just like overall vibration data or RPM is. The trends can be viewed by double clicking the point of interest.

This feature allows for an almost endless options of different data inputs that may aid you in analysis or just understanding performance as it relates to vibration signatures present in your data.

Other data input options will be covered in upcoming blog posts.

!
by Bertrand Wascat | | January 7, 2021
Share :

View our resources

Visit our library of educational videos, podcasts and more.

View more

Suscribe to the blog

Ici formulaire à venir

Would you like to…?