


Cadence™
The ultimate environmental monitoring software platform
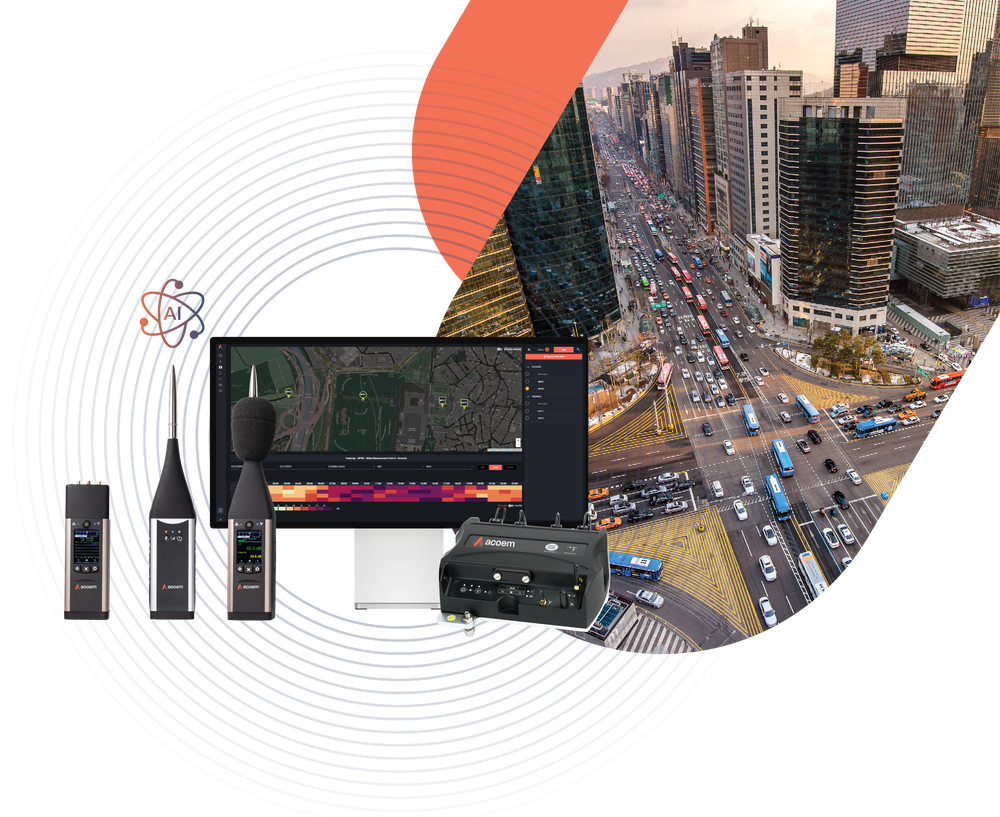
Take control of your environmental noise and vibration monitoring with Cadence™ – a simple-to-operate, online management platform that gives you the power to measure and track environmental data in real time from a single acoustic monitor or your entire network of sensors. As the optimal environmental monitoring software solution, Cadence™ takes the guesswork out of storing your data safely, allowing access for authorised personnel with a foolproof, AI-powered alert system. Its heightened technology lets you communicate with stakeholders, perform quick analysis and deliver compliance reporting at the touch of a button.
Cadence™ is the only acoustic and vibration monitoring software you will ever need, integrating seamlessly with the entire Acoem suite of noise and vibration measurement devices and instruments.