














Behind the sleek glass facades of modern office buildings, a subtle shift is redefining how we view workplace wellness. While companies have long focused on ergonomic desks and mental health perks, occupational health experts are now calling attention to a fundamental yet overlooked element of the working environment: Indoor Air Quality (IAQ).
Most people recognise the experience. Halfway through a meeting in a crowded boardroom, staying alert becomes noticeably harder as tiredness sets in. While simple afternoon weariness is often seen as the cause, some experts suggest that poor indoor air might also play a part.
Optimising your workspace starts with knowing what you actually breathe. You cannot manage what you do not measure. Indoor air is emerging as a critical public health hazard, with indoor pollutant levels reaching up to 10 to 200 times higher than outdoors. Because workers cannot actively sense rising carbon dioxide or fine particulates until symptoms take over, real-time air monitoring and active ventilation control are now becoming non-negotiable.
How indoor air constituents impact health
Every constituent of indoor air interacts differently with human biology. Identifying these elements allows health and safety leads, as well as facilities management, to create precise, effective environmental management plans.
Pollutant |
Immediate symptoms |
|---|---|
| PM 2.5 (Fine particulates) | Coughing, throat irritation, eye strain, asthma flare-ups |
| PM 10 (Coarse particulates) | Sneezing, sinus congestion, allergic rhinitis |
| VOCs (Volatile organic compounds) | Headaches, dizziness, brain fog, nausea |
Every constituent of indoor air interacts differently with human biology. Identifying these elements allows health and safety leads, as well as facilities management, to create precise, effective environmental management plans.
How airborne particles infiltrate the body
Far from being just a respiratory issue, air pollution affects the whole body and directly impacts neurological health. When we inhale, larger particles get trapped in the upper respiratory tract’s natural mucosal defences. However, fine and ultra-fine particulates (PM2.5) bypass these barriers entirely, penetrating deep into the lungs and crossing into the bloodstream.
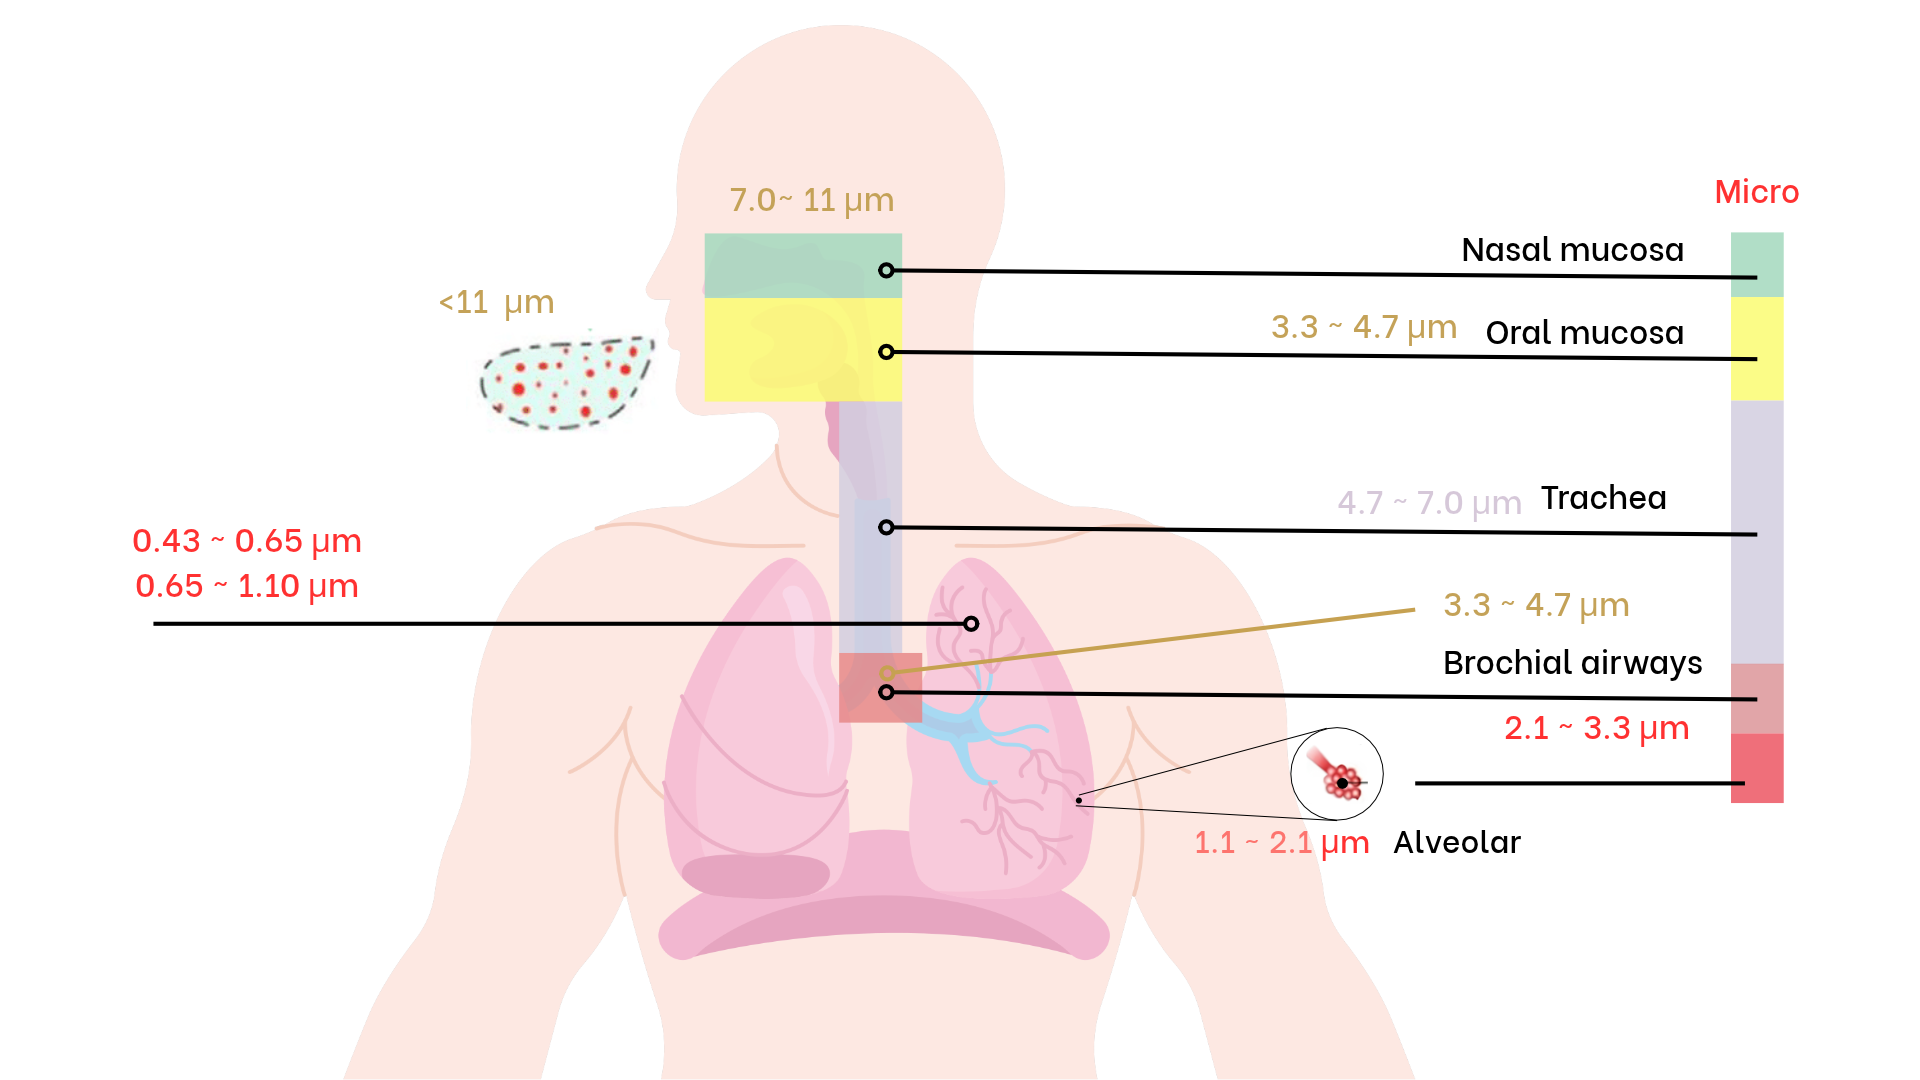
Once in systemic circulation, these toxins travel throughout the body to reach critical organs, including the brain. Beyond immediate cognitive slumps, managing air quality helps protect against chronic heart and lung conditions, reduced dementia risk, and Sick Building Syndrome (SBS). Over time, cleaner indoor air supports long-term physical health and daily mental clarity.
Common sources of indoor air pollution
Industrial and office environments often contain overlooked pollutant sources, including:
| Category | Pollutant source | Key pollutants | Health & operational impact |
|---|---|---|---|
| HVAC systems | Contaminated ducts, clogged filters, dirty cooling coils | Mould spores, bacteria, dust | Spreads bio-contaminants across zones, triggering allergies and Sick Building Syndrome. |
| Office equipment | Laser printers, copiers, high-heat electronics | fine particulate dust PM2.5, VOCs | Toner fusing and heating release micro-dust and reactive gases, causing headaches and airway irritation. |
| Building materials | New carpets, particleboard furniture, fresh paint | Formaldehyde, volatile organic compounds (VOCs) | Solvents and adhesives off-gas into enclosed air, driving brain fog, eye strain, and nausea. |
| Cleaning & fragrances | Disinfectants, chemical solvents, commercial air fresheners | Synthetic fragrances, harsh chemical fumes | Masks odours without cleaning air, triggering migraines, cognitive irritation, and loss of focus. |
The link between air quality and cognitive performance
Air quality has a direct effect on brain function, particularly when it comes to concentration and decision-making. Carbon dioxide is commonly used as an indicator of ventilation levels. While official exposure limits are relatively high, research shows that much lower concentrations can still affect performance.
This can influence decision-making, reaction times, and the ability to think strategically. Even slight increases in indoor pollutants have been linked to measurable declines in performance, particularly in environments that demand sustained focus.
- 800 to 1,000 parts per million
of indoor carbon dioxide is the threshold where individuals may begin to experience physical symptoms such as headaches and fatigue. - Up to 15%
decline in cognitive performance has been observed at moderate indoor carbon dioxide levels (~945 ppm), with reductions reaching roughly 50% when concentrations climb to around 1,400 ppm. - Slower response times and lower accuracy
across cognitive tasks are associated with elevated PM 2.5 levels and reduced ventilation rates in work environments across multi country research by Harvard researchers.
How to accurately measure indoor air quality
Accurate air quality assessment requires dedicated monitoring devices—such as continuous IAQ monitor units or multi-sensor environmental devices equipped to track CO2, PM2.5, and VOC levels. To capture reliable, unskewed data across your facility using these devices, follow this step-by-step methodology:
1. Identify target sampling zones

Select priority areas across your facility, focusing on densely populated conference rooms, open workstation clusters, and central ventilation return ducts to capture representative exposure levels.
2. Position devices in the breathing zone

Mount monitoring hardware between 1.5 and 2 metres above the floor. This places the sensors directly within the human breathing zone for both seated and standing occupants.
3. Isolate hardware from direct airflow

Place devices at least 1 to 2 metres away from doors, windows, and HVAC supply vents to prevent localised drafts from skewing baseline pollutant readings.
4. Shield devices from microclimates
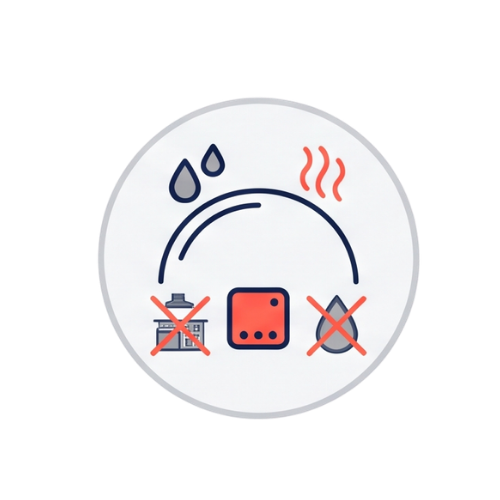
Keep monitors clear of high-humidity sources like kitchens, restrooms, and humidifiers to prevent moisture interference with sensor optics and VOC readings.
5. Establish baseline and peak tracking
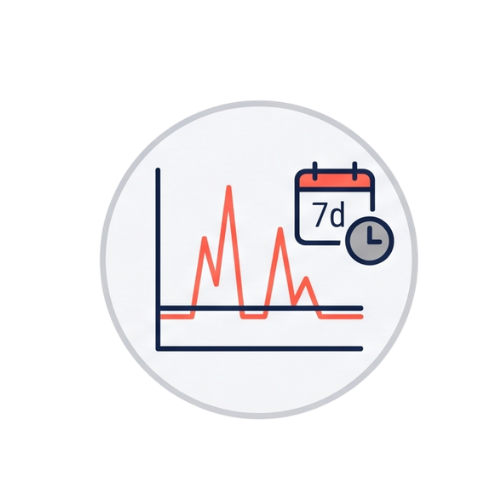
Run continuous monitoring over a minimum 7-day cycle to establish true ambient baselines, mapping peak concentration spikes against occupancy hours and HVAC schedules.
Partnering for healthier indoor environments
Creating a safer indoor environment is straightforward. Whether you are evaluating compliance, optimising ventilation, or analysing air dynamics, we can help. We offer a broad range of instruments tailored to your facility, including continuous IAQ monitor units, multi-sensor environmental devices, and dedicated particle or gas analysers.