Features
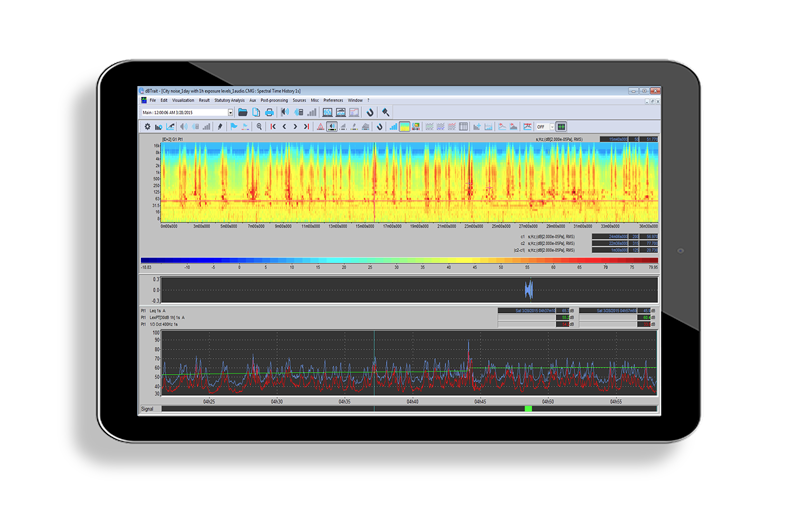
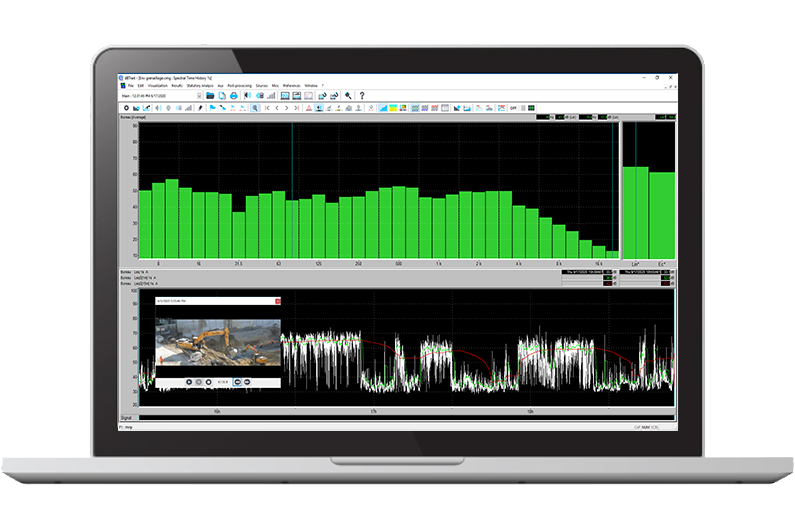
Multi-curve
Multi-curve display of trends in global and spectral indicators over time
Template
Display of regulatory templates
Calculation of mean indicators:
Leq over period, Lden
Statistical calculation:
Per source, per period, etc.
Analysis of metrological signals:
Replay, 1/N octave, FFT, short Leq, etc.
#
manual coding, on threshold, crossed between channels
Googlemaps
display of measurement sites on Googlemaps
Export data
export to Word and Excel
#
Combined with the WebMonitoring service offer, dBTrait provides customers with an accurate analysis of raw data (available by FTP transfer) in addition to the information available on the project web site.
Resources


Applications
Discover Acoem’s case studies


Connect with Acoem
Contact us to learn more about our solutions, services, and training programs.
Would you like to…?


