Figure 3.12 Two dial indicators are used to determine the relative position of the movable shaft with respect to the stationary shaft.
![](https://cdn.bfldr.com/Q3Z2TZY7/at/4srjxqwzgjm9kcszmcgspcmj/Reliability-_resources_-_blog_-_Rim-Face-Alignment-Overview-1.jpg?auto=webp&format=jpg&auto=webp&width=800)
Figure 3.13 The rim dial is used to measure offset in one plane along the shaft lengths.
![](https://cdn.bfldr.com/Q3Z2TZY7/at/msb9xq8p3s6r4fntsh3rgwm/Reliability-_resources_-_blog_-_Rim-Face-Alignment-Overview-2.jpg?auto=webp&format=jpg&auto=webp&width=800)
Figure 3.14 The face dial measures angularity or slope between the shafts.
![](https://cdn.bfldr.com/Q3Z2TZY7/at/k6vp3k3t3w3kn3q587wfbkt8/Reliability-_resources_-_blog_-_Rim-Face-Alignment-Overview-3.jpg?auto=webp&format=jpg&auto=webp&width=800)
Figure 3.15 Uncoupled shafts.
![](https://cdn.bfldr.com/Q3Z2TZY7/at/sf5vmftzcvgbmxmfs72hv9g/Reliability-_resources_-_blog_-rim_-_face_-_alignment.jpg?auto=webp&format=jpg&auto=webp&width=800)
Figure 3.16 Coupled shafts, rim dial.
![](https://cdn.bfldr.com/Q3Z2TZY7/at/9ccwbw4crbrw465vp3t9crr/Reliability-_resources_-_blog_-_Rim-Face-Alignment-Overview-2-300x134-1.jpg?auto=webp&format=jpg&auto=webp&width=800)
Figure 3.17 Coupled shafts, face dial
![](https://cdn.bfldr.com/Q3Z2TZY7/at/bz5m2f5smpt3c4w32vphtm7/Reliability-_resources_-_blog_-Rim-Face-Fixture-Overview-3.jpg?auto=webp&format=jpg&auto=webp&width=800)
Figure 3.18 Mounting fixtures
![](https://cdn.bfldr.com/Q3Z2TZY7/at/jx57mrnvfftgqgx3rgpqw4s/Reliability-_resources_-_blog_-_Mounting-Rim-Face-Fixtures-1.jpg?auto=webp&format=jpg&auto=webp&width=800)
Figure 3.20 Documenting as found readings.
![](https://cdn.bfldr.com/Q3Z2TZY7/at/cj5nz7g76fq9vhspjqqx7f/Reliability-_resources_-_blog_-_Obtaining-As-found-Readings-1.jpg?auto=webp&format=jpg&auto=webp&width=800)
Figure 3.21 Measuring vertical misalignment, 6 o’clock.
![](https://cdn.bfldr.com/Q3Z2TZY7/at/9grxvmhfr5499n5nz2ctnqb/Reliability-_resources_-_blog_-_Measuring-Vertical-Misalignment.jpg?auto=webp&format=jpg&auto=webp&width=800)
Figure 3.22 Setting the sag value
![](https://cdn.bfldr.com/Q3Z2TZY7/at/hfqcpwm4ncgt4xv9xgbj9/Reliability-_resources_-_blog_-_Measuring-Vertical-Misalignment-2-196x300-1.jpg?auto=webp&format=jpg&auto=webp&width=800)
Figure 3.23 Measuring vertical misalignment, 12 o’clock.
![](https://cdn.bfldr.com/Q3Z2TZY7/at/g3hz6zbht8mjzmsfphh3hhz/Reliability-_resources_-_blog_-_Measuring-Vertical-Misalignment-3.jpg?auto=webp&format=jpg&auto=webp&width=800)
Figure 3.24 Example, TIR readings.
![](https://cdn.bfldr.com/Q3Z2TZY7/at/wgsckxgt32crgq6wrncm685/Reliability-_resources_-_blog_-_Interpreting-Vertical-Misalignment-Data-1.jpg?auto=webp&format=jpg&auto=webp&width=800)
![](https://cdn.bfldr.com/Q3Z2TZY7/at/ns4gpbb7x5zqjbtcpg8hr/Reliability-_resources_-_blog_-_Interpreting-Vertical-Misalignment-Data-2.jpg?auto=webp&format=jpg&auto=webp&width=800)
Figure 3.25 Measuring horizontal misalignment
![](https://cdn.bfldr.com/Q3Z2TZY7/at/26fvpmhw8hk4jg85fwvvq9b/Reliability-_resources_-_blog_-Measuring-Horizontal-Misalignment-11.jpg?auto=webp&format=jpg&auto=webp&width=800)
Figure 3.26 Measuring horizontal misalignment, 9 o’clock
![](https://cdn.bfldr.com/Q3Z2TZY7/at/b5fx9crjm9hnkhwkpt7h8/Reliability-_resources_-_blog_-Measuring-Horizontal-Misalignment-2.jpg?auto=webp&format=jpg&auto=webp&width=800)
Figure 3.27 Measuring horizontal misalignment, 3 o’clock.
![](https://cdn.bfldr.com/Q3Z2TZY7/at/sw6jwxv84cxpqnfzkvtx544/Reliability-_resources_-_blog_-Measuring-Horizontal-Misalignment-3.jpg?auto=webp&format=jpg&auto=webp&width=800)
Figure 3.28 Example, horizontal TIR readings.
![](https://cdn.bfldr.com/Q3Z2TZY7/at/gs5jj5nx6q5ncjvcqbj9hn/Reliability-_resources_-_blog_-_Interpreting-Horizontal-Misalignment-Data-1.jpg?auto=webp&format=jpg&auto=webp&width=800)
![](https://cdn.bfldr.com/Q3Z2TZY7/at/xfg3mpcphcn6xt3khpcnt7/Reliability-_resources_-_blog_-_Interpreting-Horizontal-Misalignment-Data-2.jpg?auto=webp&format=jpg&auto=webp&width=800)
Figure 3.29 Set up and dimensions
![](https://cdn.bfldr.com/Q3Z2TZY7/at/4hg653rcq95k2q86958xs34b/Reliability-_resources_-_blog_-_Rim-Face-Calculations-1-300x154-1.jpg?auto=webp&format=jpg&auto=webp&width=800)
Figure 3.30 Equation, front feet calculation
![](https://cdn.bfldr.com/Q3Z2TZY7/at/v79f7xb3qxnxkqm5nck4m7c/Reliability-_resources_-_blog_-_Rim-Face-Calculations-2.jpg?auto=webp&format=jpg&auto=webp&width=800)
Figure 3.31 Equation, rear feet calculation
![](https://cdn.bfldr.com/Q3Z2TZY7/at/grvhcvvm6mxkxvsgfhh8j9x/Reliability-_resources_-_blog_-_Rim-Face-Calculations-3.jpg?auto=webp&format=jpg&auto=webp&width=800)
Figure 3.32 Front feet calculation. The front feet are 26 mils (0.66 mm) too high; shims need to be removed.
![](https://cdn.bfldr.com/Q3Z2TZY7/at/9s3htfv6xx2tsnmf887pr77/Reliability-_resources_-_blog_-Rim-Face-Calculations-4-300x101-1.jpg?auto=webp&format=jpg&auto=webp&width=800)
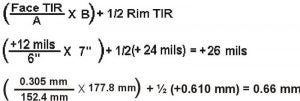
Figure 3.33 Rear feet calculation. The rear feet are 74.0 mils (1.88 mm) too high; shims need to be removed.
![](https://cdn.bfldr.com/Q3Z2TZY7/at/7mq3r4fsvvn3j48s6jntk/Reliability-_resources_-_blog_-_Rim-Face-Calculations-5-300x94-1.jpg?auto=webp&format=jpg&auto=webp&width=800)
Figure 3.34 Setting up the graph.
![](https://cdn.bfldr.com/Q3Z2TZY7/at/wg8qbxcb7t3vpbfk3bfqmt8f/Reliability-_resources_-_blog_-Rim-Face-Graph-1.jpg?auto=webp&format=jpg&auto=webp&width=800)
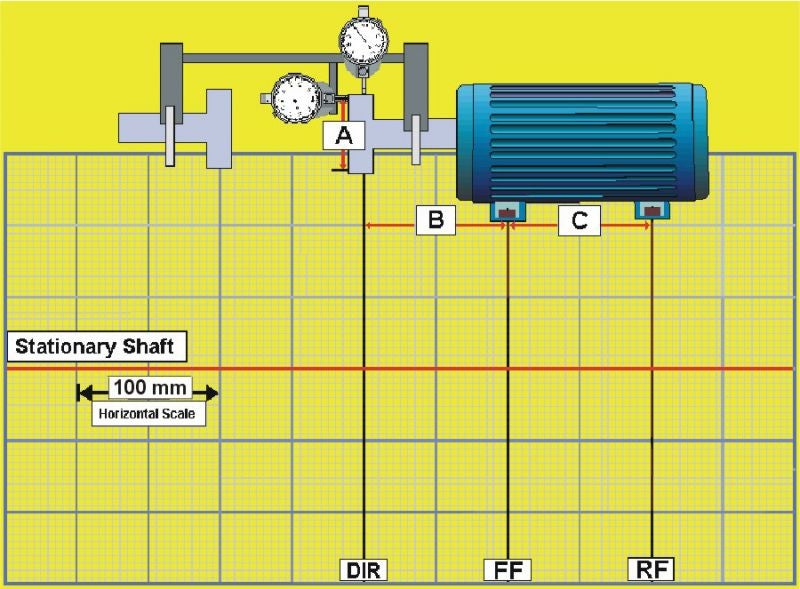
Figure 3.35 Plotting
![](https://cdn.bfldr.com/Q3Z2TZY7/at/hkcmwchh2p4834w77hnch5tr/Reliability-_resources_-_blog_-_Rim_-_face_-2.jpg?auto=webp&format=jpg&auto=webp&width=800)
Figure 3.36 Graph, feet positions.
![](https://cdn.bfldr.com/Q3Z2TZY7/at/f729h9fskt76qggfpqp3hs/Reliability-_resources_-_blog_-Rim-Face-Graph-3.jpg?auto=webp&format=jpg&auto=webp&width=800)
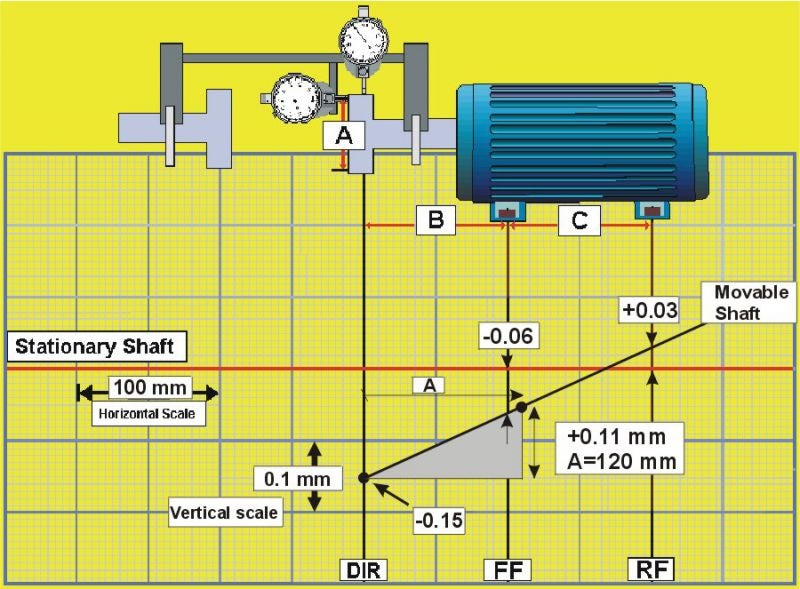
Figure 3.37 Making vertical corrections
![](https://cdn.bfldr.com/Q3Z2TZY7/at/f729h9fskt76qggfpqp3hs/Reliability-_resources_-_blog_-Rim-Face-Graph-3.jpg?auto=webp&format=jpg&auto=webp&width=800)
Figure 3.38 Horizontal corrections. Dial indicator at the feet.
![](https://cdn.bfldr.com/Q3Z2TZY7/at/h8txn7fb4xx96x4srqjmgmz/Reliability-_resources_-_blog_-Rim-Face-Corrections-2.jpg?auto=webp&format=jpg&auto=webp&width=800)
Figure 3.39 Horizontal corrections. Monitoring dial indicators mounted at the coupling.
![](https://cdn.bfldr.com/Q3Z2TZY7/at/vz8q9fcxps8bwpc3b3s8nzv/Reliability-_resources_-_blog_-Rim-Face-Corrections-3-300x259-1.jpg?auto=webp&format=jpg&auto=webp&width=800)